
App install campaigns have a quality problem that cost-per-install metrics systematically obscure. Industry benchmarks confirm the pattern across most app categories. Day-30 retention averages just 4–12% for broad demographic campaigns. That means 88–96% of users acquired through standard Meta or Google formats stop using the app within a month. For gaming apps the figure is typically 4–8%. E-commerce sits around 5%. Fintech does somewhat better, at 10–15%. The true cost of a low-retention install is not the CPI. It is the CPI plus onboarding cost, server infrastructure, customer service overhead, and the lost LTV of a user who was never genuinely interested. A $0.80 CPI install that churns on Day 3 is not a cheap install. It is an expensive waste with no path to payback. The industry has optimised for volume when the commercial imperative is quality.
“The CPI metric measures the cost of getting an app on someone’s phone. It says nothing about whether that person was ever going to use it. The retention curve is the real scorecard.”
App Install Campaigns: Signals That Predict Retention
TrueSignal’s approach to app install campaigns starts from the intent signal, not the demographic segment. Certain behavioural signals are visible in the mobile network. These include usage patterns of competing or complementary apps, financial readiness indicators, device upgrade recency, and engagement intensity. Together they identify subscribers genuinely likely to adopt and retain a specific app category. The targeting brief for a fintech app is a good example. It is built not on “25–34, urban, Android” but on “subscriber showing active engagement with financial services data, recent device upgrade, salary credit event in the last 7 days.” That is a fundamentally different population, and its Day-30 retention reflects the difference.
Before the install, TrueSignal uses RCS to deliver a full in-message app preview, giving the user a genuine experience of the app before they commit to a download. This pre-install quality filter converts better and retains better, because users who install after previewing have self-selected for genuine interest.
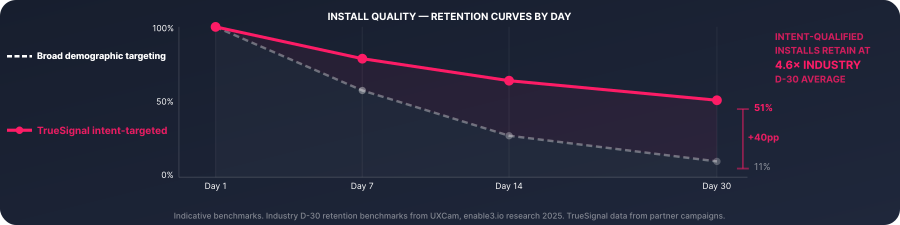
Four Times The Retention
In a 2025 campaign for a Southeast Asian fintech app, CPI came in 61% below the client’s prior Meta benchmark. The campaign ran across a TrueSignal MNO partner network. Day-30 retention reached 51%, versus 12% on the Meta campaign. The LTV math is unambiguous. A user retained to Day 30 at a 61% lower acquisition cost represents a fundamentally different return on investment. For the app publisher, the financial model shifts from “acquire many, retain few” to “acquire fewer, retain most.” The budget required to reach a given number of retained users falls dramatically. Meanwhile, revenue per marketing dollar rises in proportion to retention quality, through in-app purchases, subscriptions, or monetised engagement. The CPI benchmark is not the wrong metric. It simply needs to be read alongside Day-30 retention to mean anything commercially. TrueSignal improves both, simultaneously, from the same signal.
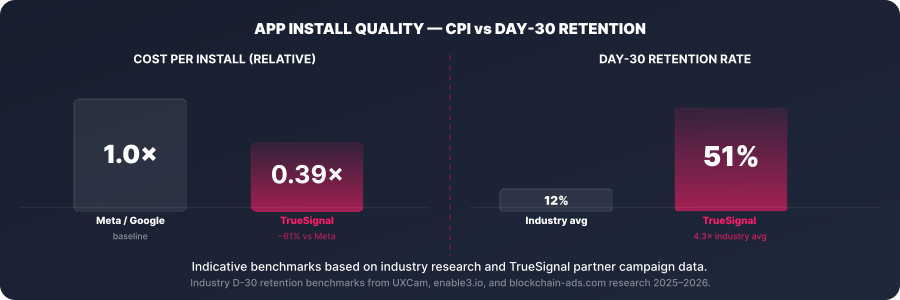
The Quality Anchor in Your Channel Mix
For growth teams managing app install budgets across multiple channels, TrueSignal integrates as a quality anchor rather than a volume replacement. The channel mix for most apps benefits from the scale of social and search, combined with the quality selectivity of intent-signal targeting. The strategic allocation shifts. Broad social campaigns build awareness and drive top-of-funnel consideration. TrueSignal-targeted RCS campaigns convert the highest-quality cohort, those whose network behaviour signals genuine readiness. They do so at a CPI that reflects the lower friction of reaching someone already predisposed to install. The conversation for app marketers changes. It moves from “how many installs can we buy?” to “what is the Day-30 retention of the users we are buying?” That question has a definitive answer when the signal is deterministic. And the answer, consistently, favours intent over reach.
SOURCES
- ↗ UXCam / enable3.io Mobile App Day-30 Retention Benchmarks 2025 — 4–12% industry average by category
- ↗ AppsFlyer State of App Marketing Report 2025
- ↗ Meta Advantage+ App Campaigns CPI benchmarks
- ↗ Adjust Mobile App Trends Report 2025